


Bitcoin remains in a corrective phase after failing to sustain the recent breakout attempt above the mid-$90,000s. The price is trading back inside a broader consolidation that has contained the market since the sharp November sell-off, while momentum has cooled, and on-chain activity shows waning participation.
The current structure is therefore best characterised as a range-bound market with a modest bearish tilt, where support levels are being tested rather than a fresh impulsive uptrend.
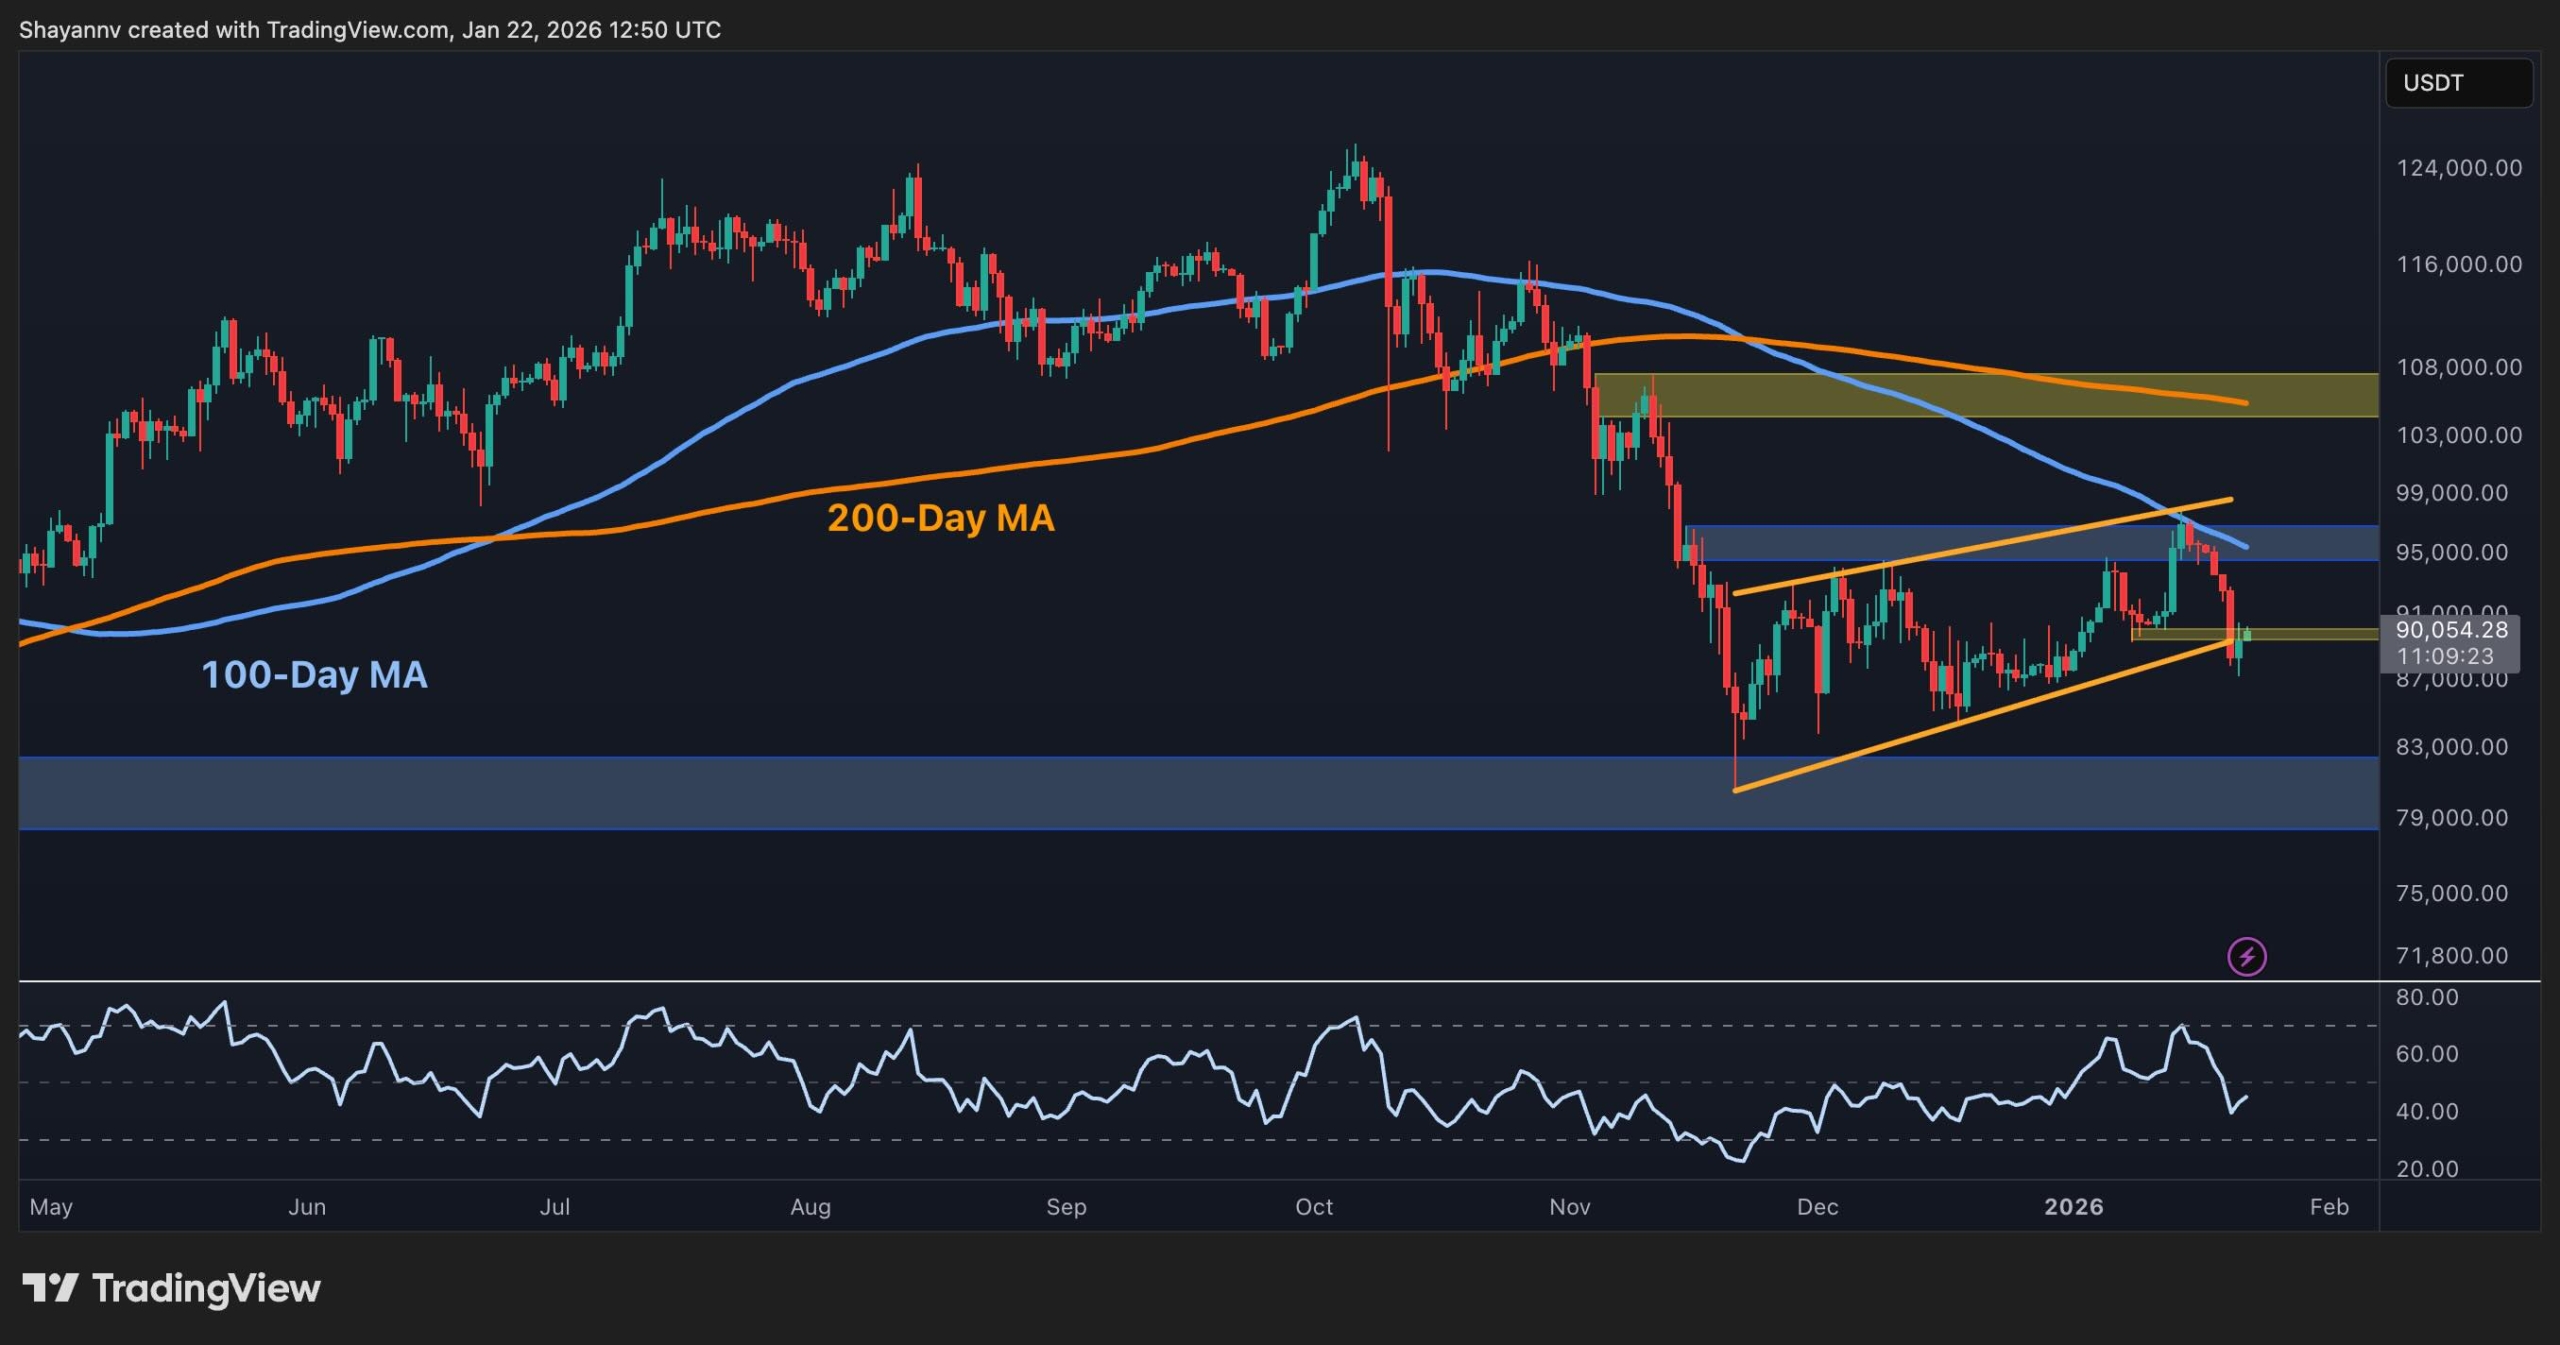
Bitcoin Price Analysis: The Daily Chart
On the daily chart, BTC has been rejected from the $95,000–$97,000 resistance band and the declining 100-day moving average, which converged with the upper boundary of the recent rising channel. That rejection has pushed the price back toward the $90,000 support area, which coincides with the lower channel boundary and the origin of the most recent leg higher.
The daily RSI has also rolled over from near overbought readings and is moving back toward neutral territory, consistent with a cooling of bullish momentum. As long as the $88,000-$90,000 region holds on a closing basis, the broader structure still allows for a constructive higher-low scenario; a daily close below this zone would instead open the way for a deeper retracement toward the $80,000 demand region that marked November’s base.
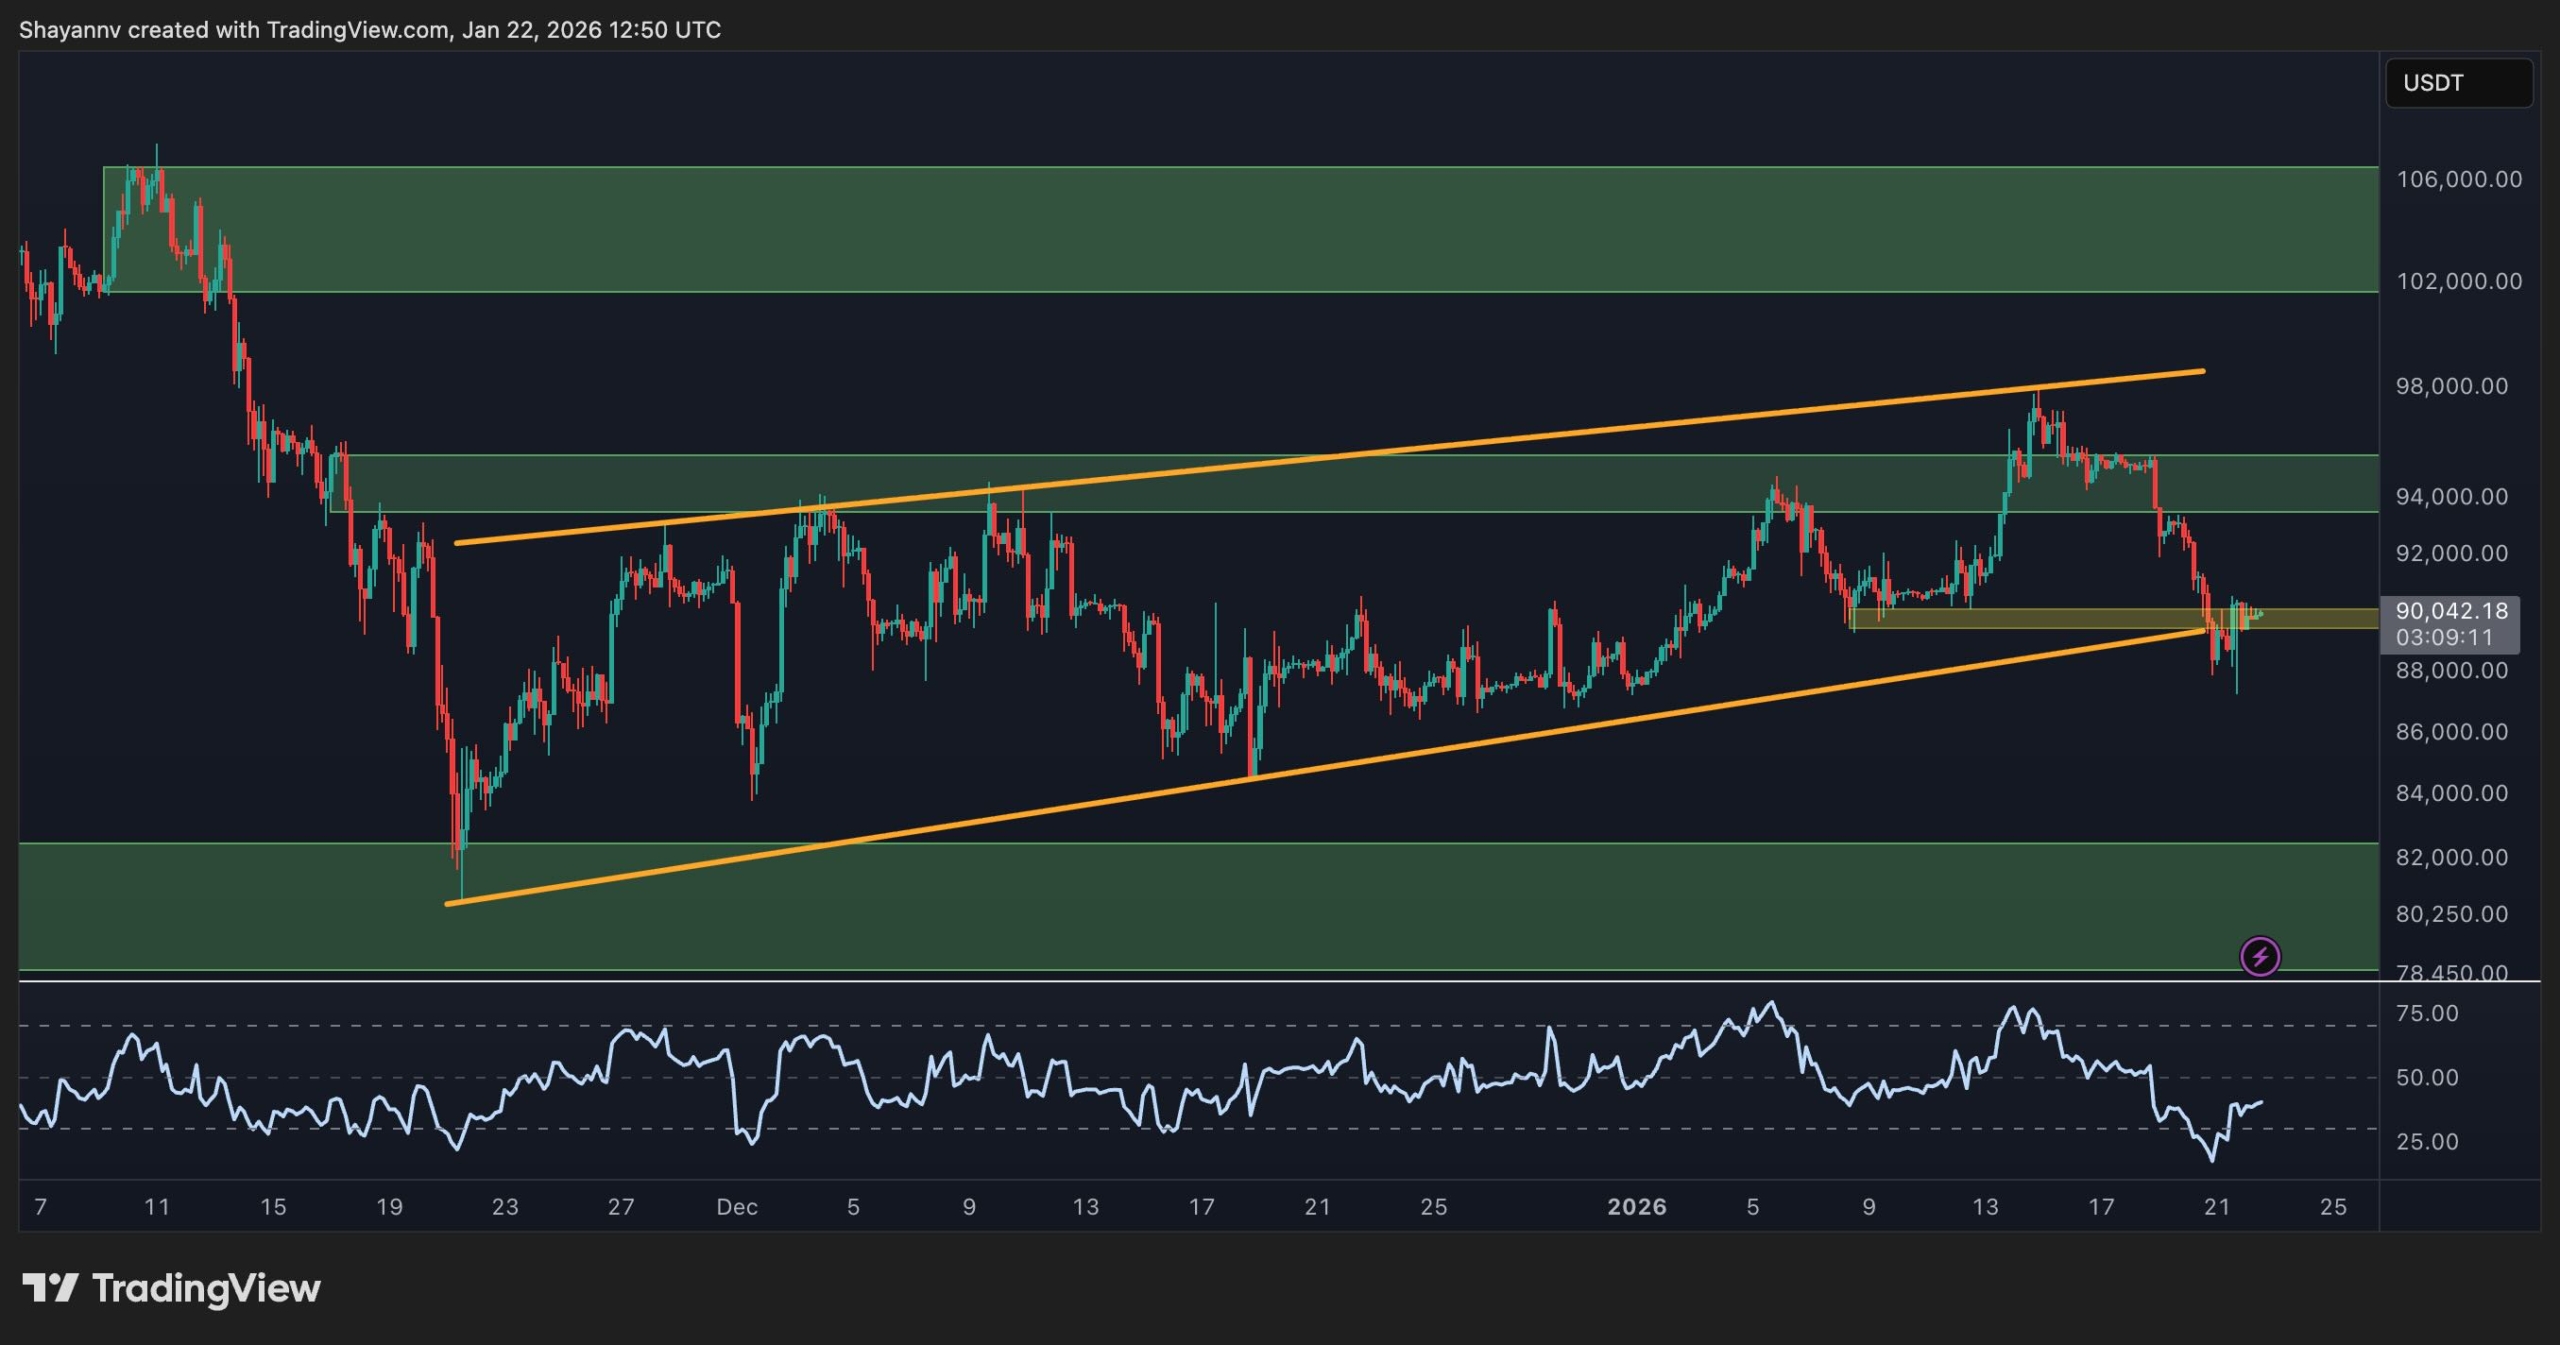
BTC/USDT 4-Hour Chart
The 4-hour chart shows the price breaking away from the upper boundary of the rising channel that has guided the advance from roughly $82,000, and is now on the verge of breaking the channel to the upside. The $90,000 zone, previously a pivot area and short-term demand, is now being retested after an intraday spike below.
The RSI on this timeframe has recovered from oversold territory but remains subdued, which fits a corrective rebound rather than renewed impulsive strength. Sustained acceptance above $90,000 would favour a gradual mean-reversion back toward the $95,000 mark within the channel. However, repeated failures at this level, or a clean breakdown below $90,000, would confirm that sellers remain in control and increase the risk of a retest of the lower daily support around $80,000.
On-Chain Analysis
On-chain data from active addresses indicate a deterioration in underlying network participation. The 30-day EMA of Bitcoin active addresses has been in a persistent downtrend since the beginning of 2025 and is currently printing new lows while the price remains elevated near the $90,000 zone.
This negative divergence suggests that recent price resilience has been driven more by existing market participants and derivatives activity than by broad new spot demand, a pattern that often aligns with late-stage rallies, choppy ranges, or corrective phases rather than the early stages of a sustained bull leg.
Historically, significant cyclical advances have coincided with a clear inflection higher in this activity metric; until a similar turn appears, conditions continue to argue for cautious positioning, with greater emphasis on capital preservation and responsiveness to support/resistance levels rather than aggressive trend-following.

SECRET PARTNERSHIP BONUS for CryptoPotato readers: Use this link to register and unlock $1,500 in exclusive BingX Exchange rewards (limited time offer).
Disclaimer: Information found on CryptoPotato is those of writers quoted. It does not represent the opinions of CryptoPotato on whether to buy, sell, or hold any investments. You are advised to conduct your own research before making any investment decisions. Use provided information at your own risk. See Disclaimer for more information.
