


Bitcoin is showing clear signs of weakness, with increasing selling pressure driving the price lower. The asset has now approached a decisive multi-month support zone, with a confirmed breakdown triggering a sharp decline toward the $111K threshold.
Technical Analysis
By ShayanMarkets
The Daily Chart
After an extended period of sideways movement within the $116K to $123K range, Bitcoin has now turned downward, breaching the lower threshold. This drop signals a rise in distribution and selling interest, with the asset now testing a major support near $114K, coinciding with the lower boundary of its long-standing price channel.
This region marks a critical battleground between buyers and sellers. A break below this level would likely trigger a new wave of sell orders, setting the stage for a deeper correction toward the $111K zone. The reaction at this pivotal level is expected to play a key role in shaping Bitcoin’s mid-term trajectory.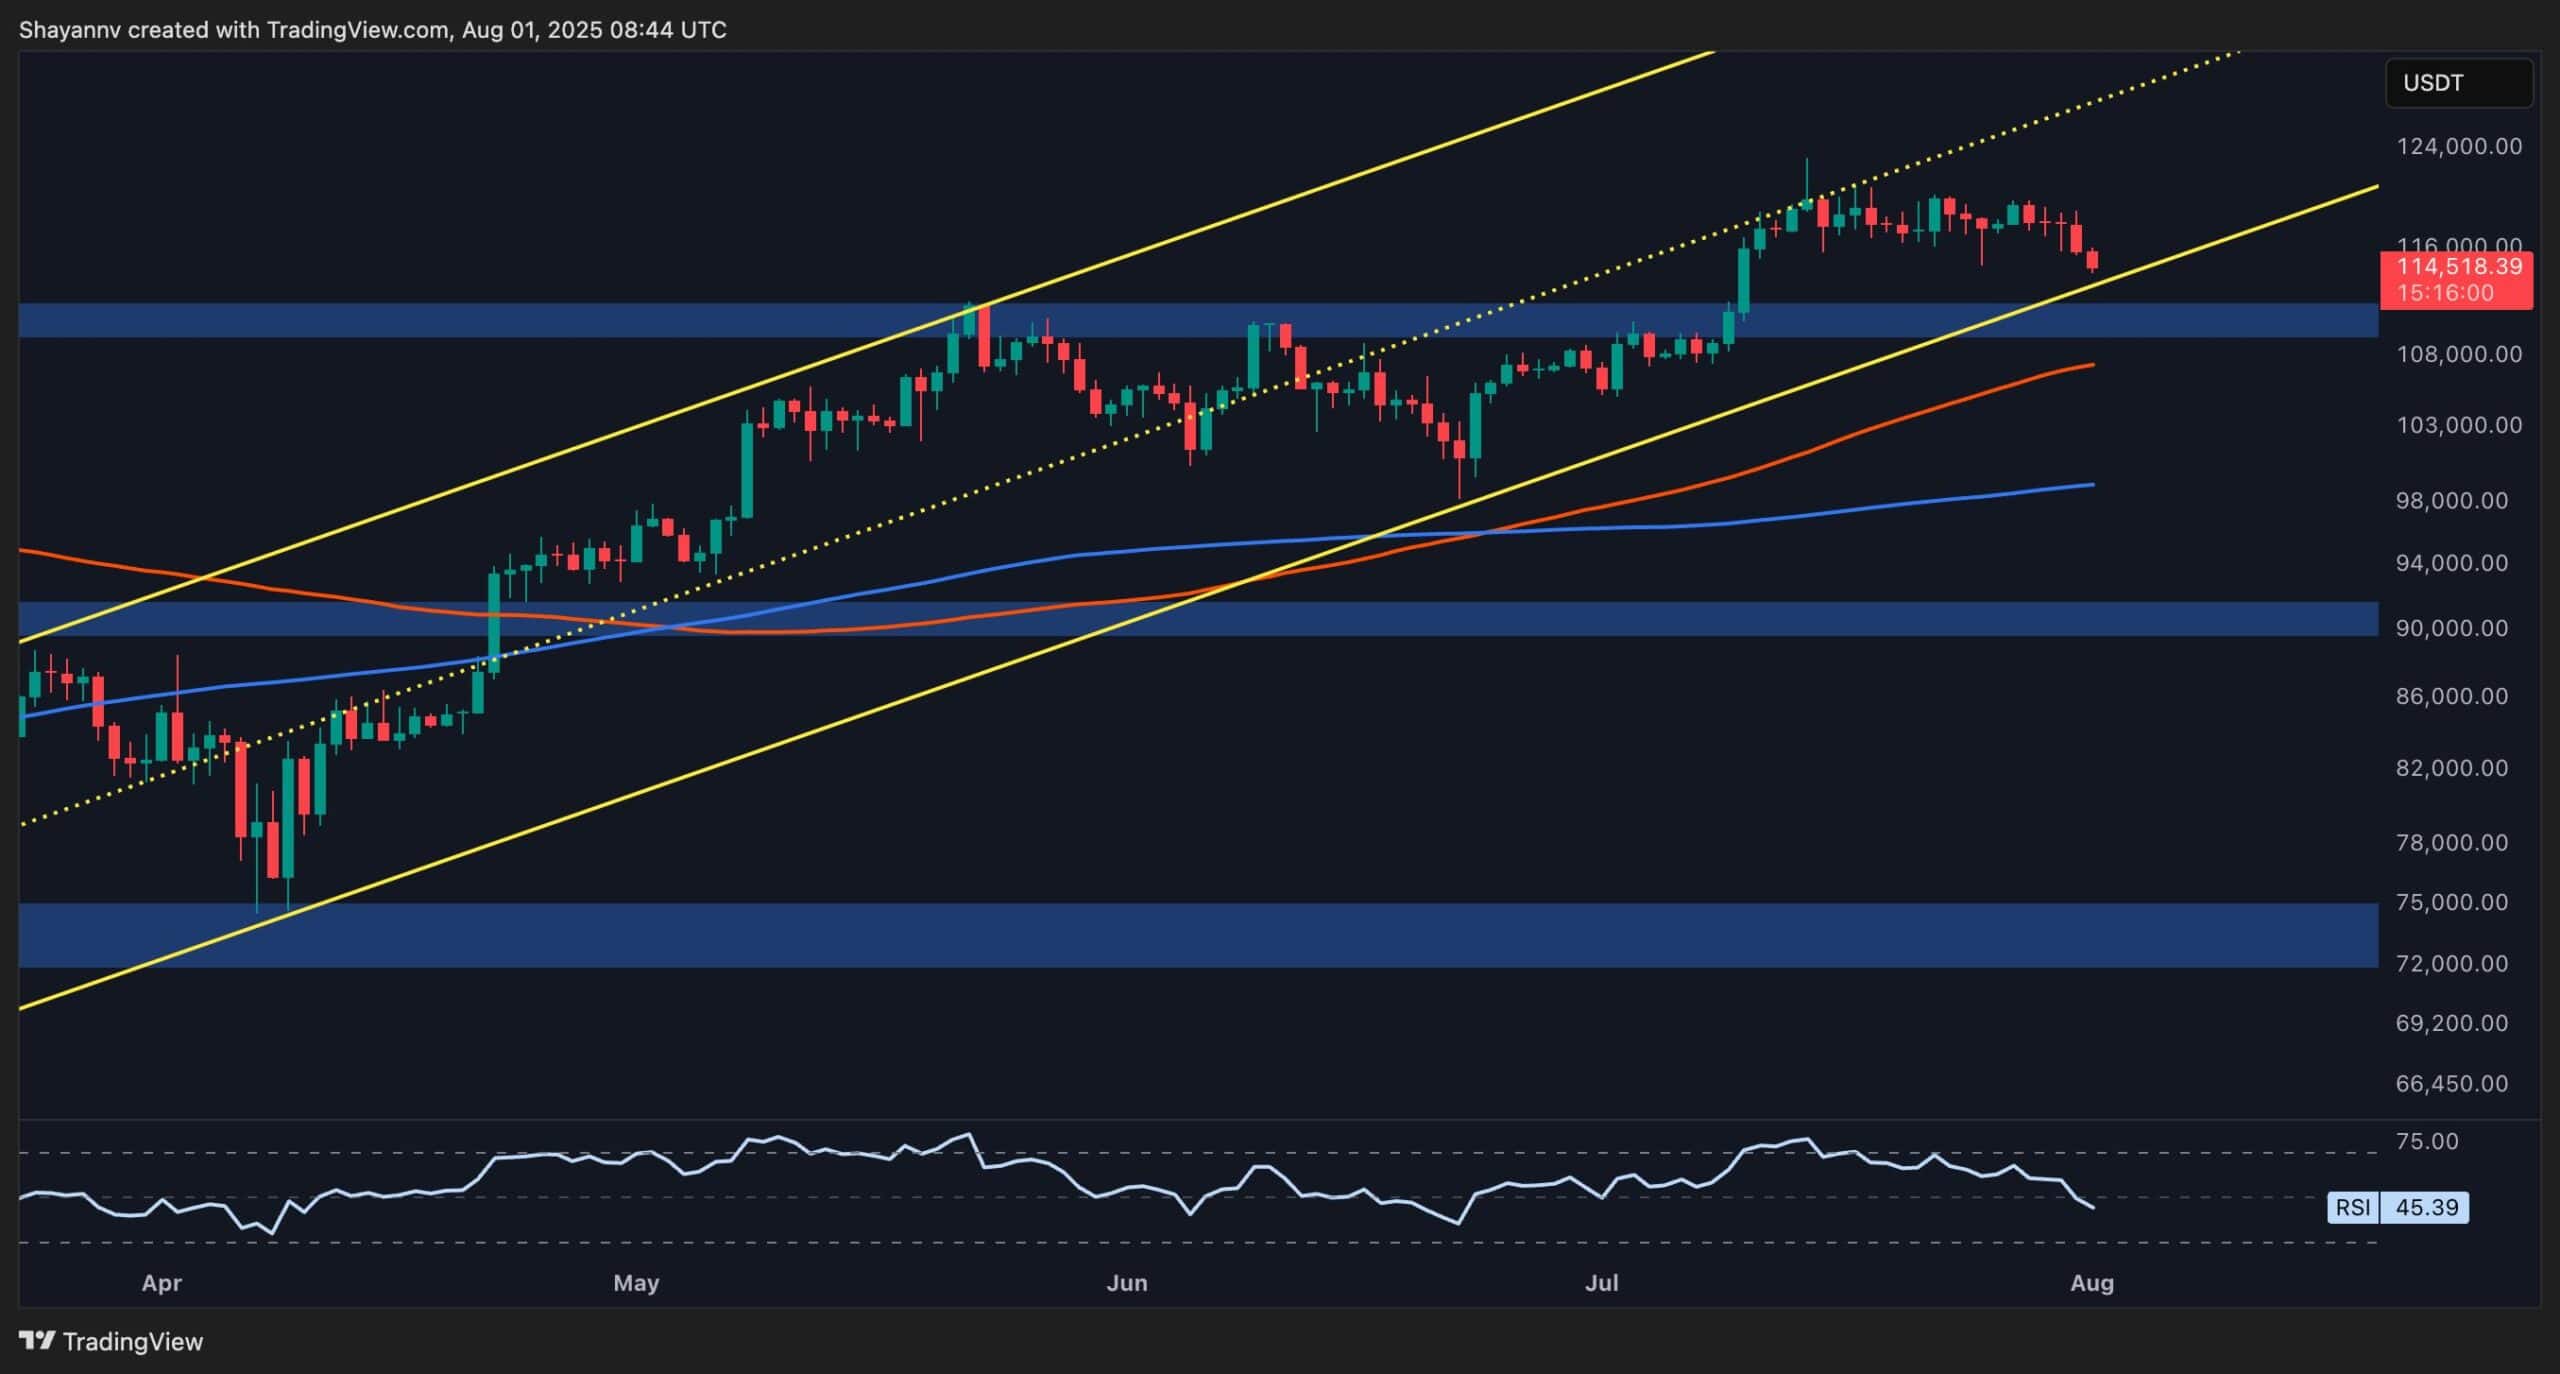
The 4-Hour Chart
Zooming in, the price was recently rejected from the upper boundary of a rising flag near $118K, signaling strong selling pressure. The recent drop has taken Bitcoin back toward the lower end of the flag structure, around $114K, which also aligns with the 0.5 Fibonacci retracement level.
This confluence creates a strong area of support. A confirmed break below this level could lead to a long-squeeze scenario, pushing the price even lower. However, if demand picks up and buyers regain control, a bounce toward the $118K zone remains possible in the short term.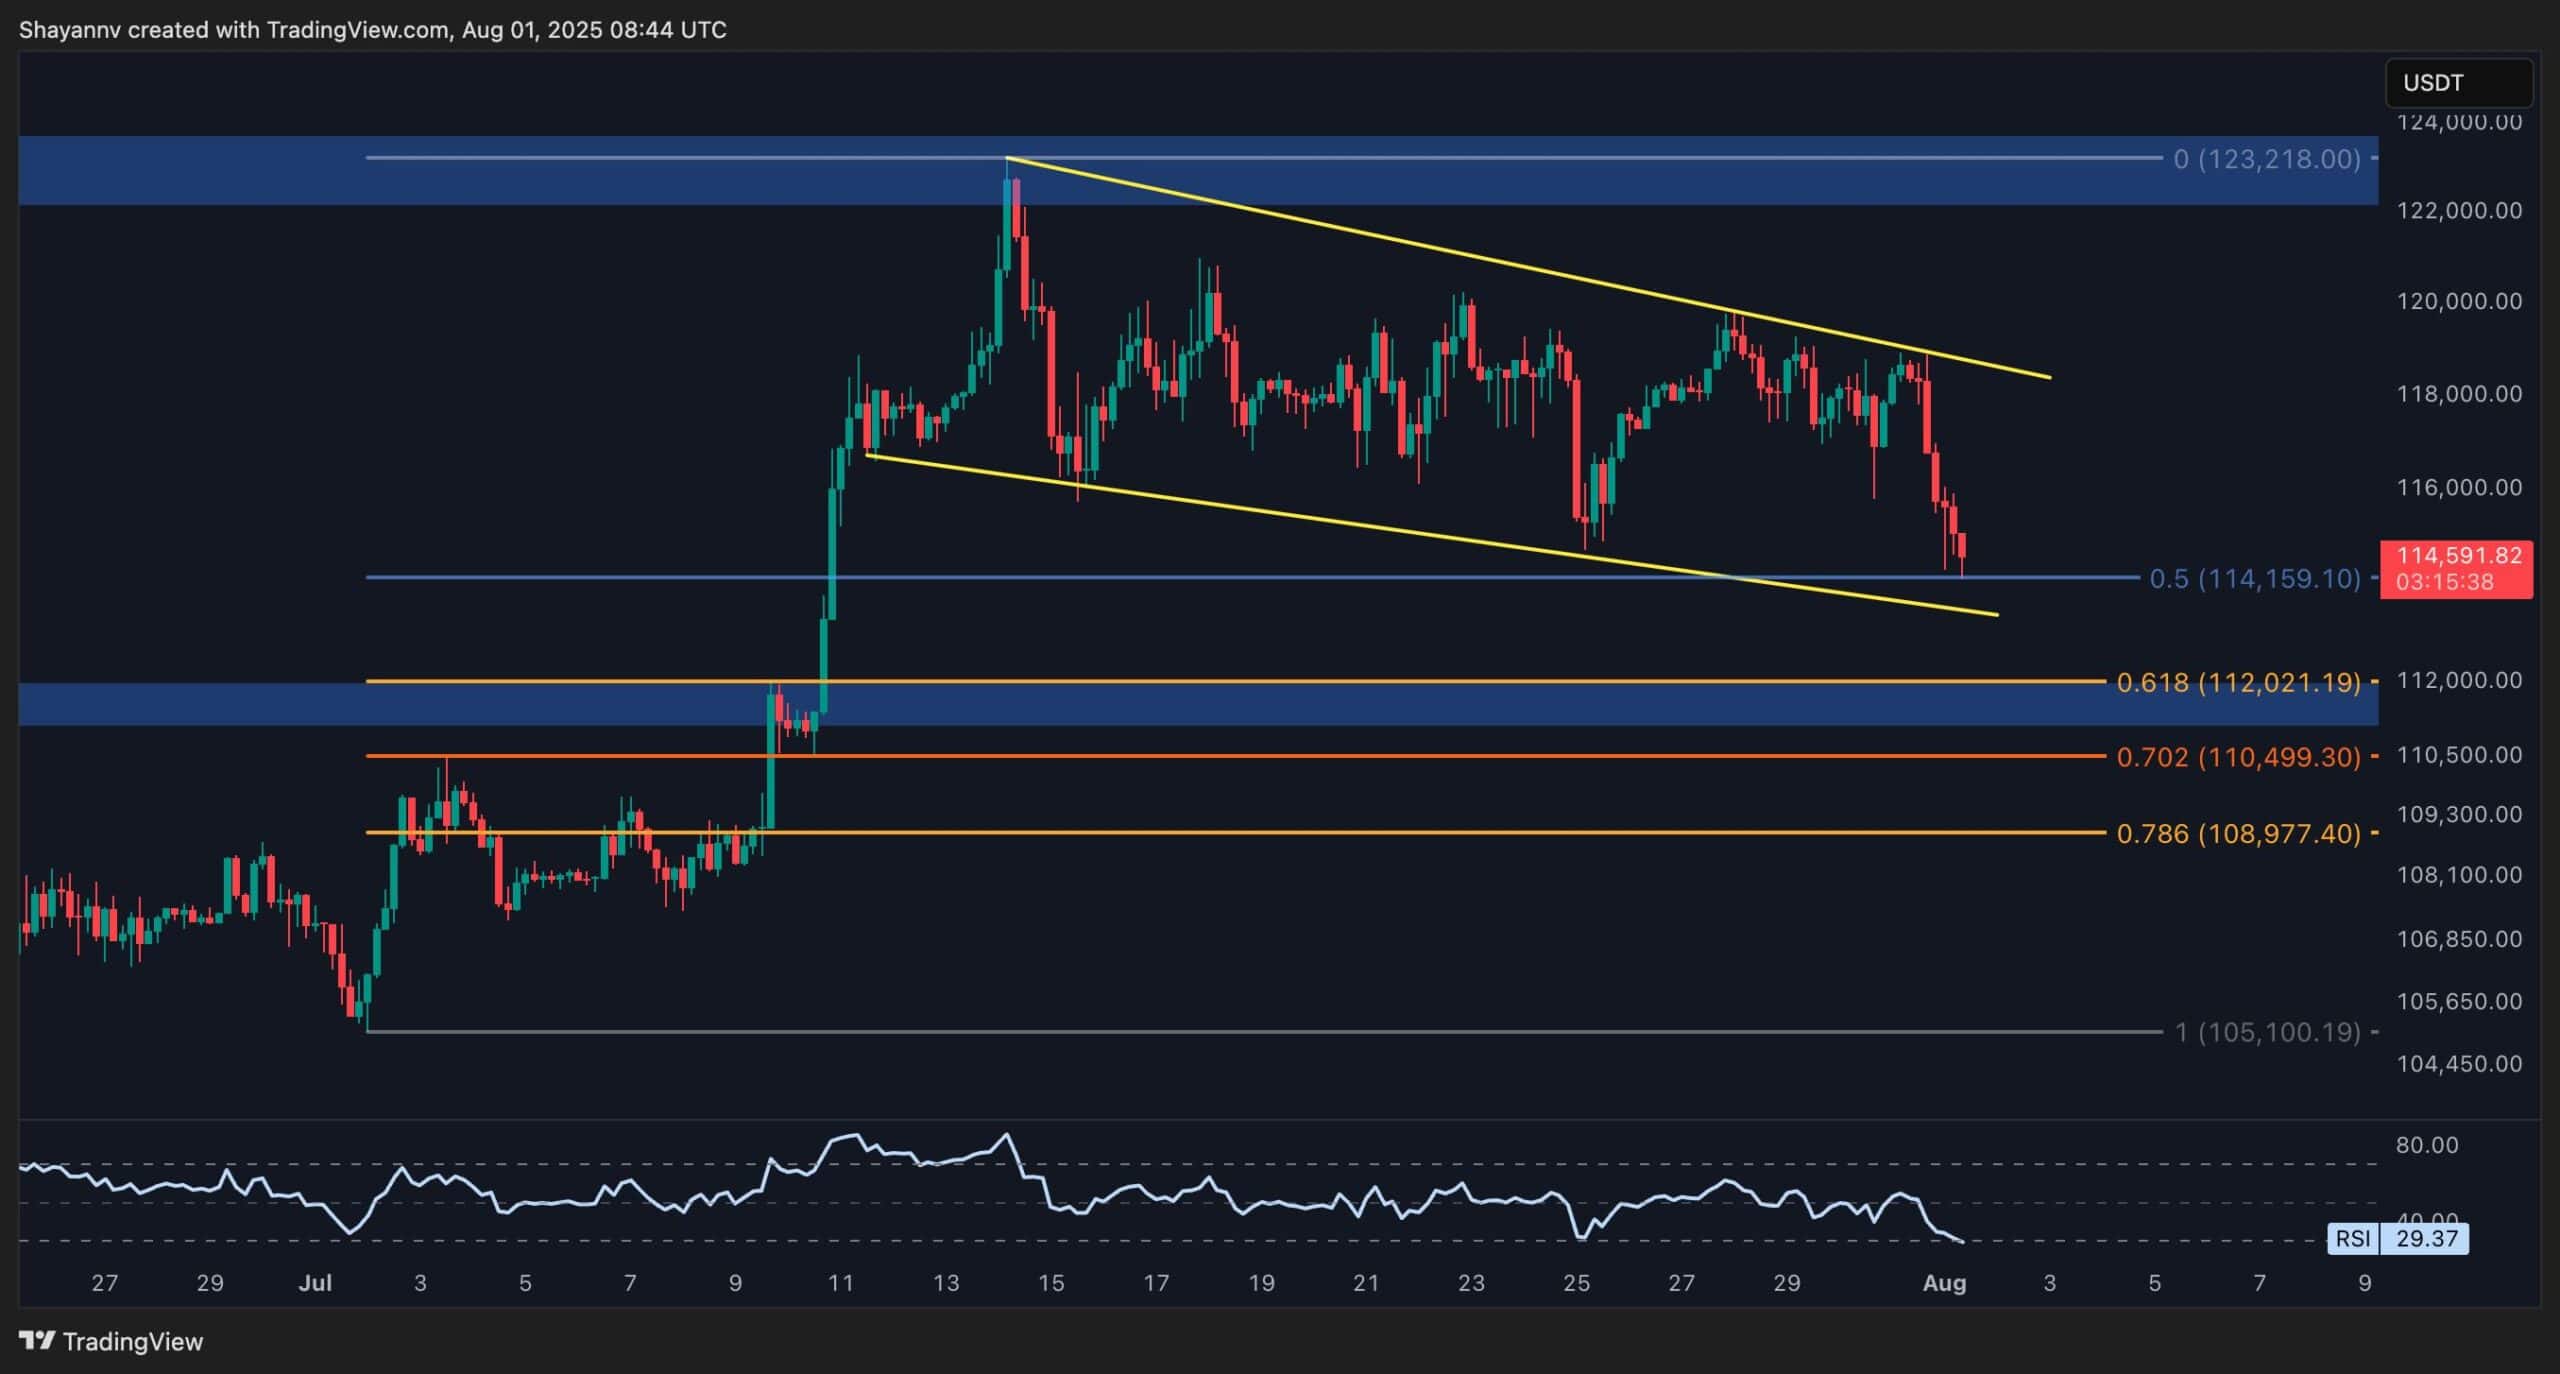
On-chain Analysis
By ShayanMarkets
The Binance BTC/USDT liquidation heatmap highlights a tense standoff within the current market structure, with Bitcoin’s price caught between two significant liquidity pockets, one concentrated above the $120K level and another below $114K. These zones mark areas of high leveraged exposure, making them key magnets for institutional players and liquidity-driven moves.
As the price hovers near the $114K threshold, the probability of a downward breakout increases. A drop below this level could trigger a chain reaction of stop-outs and liquidations, driving sharp downside momentum. Traders should monitor these zones closely, as any decisive move could unleash rapid and volatile price swings.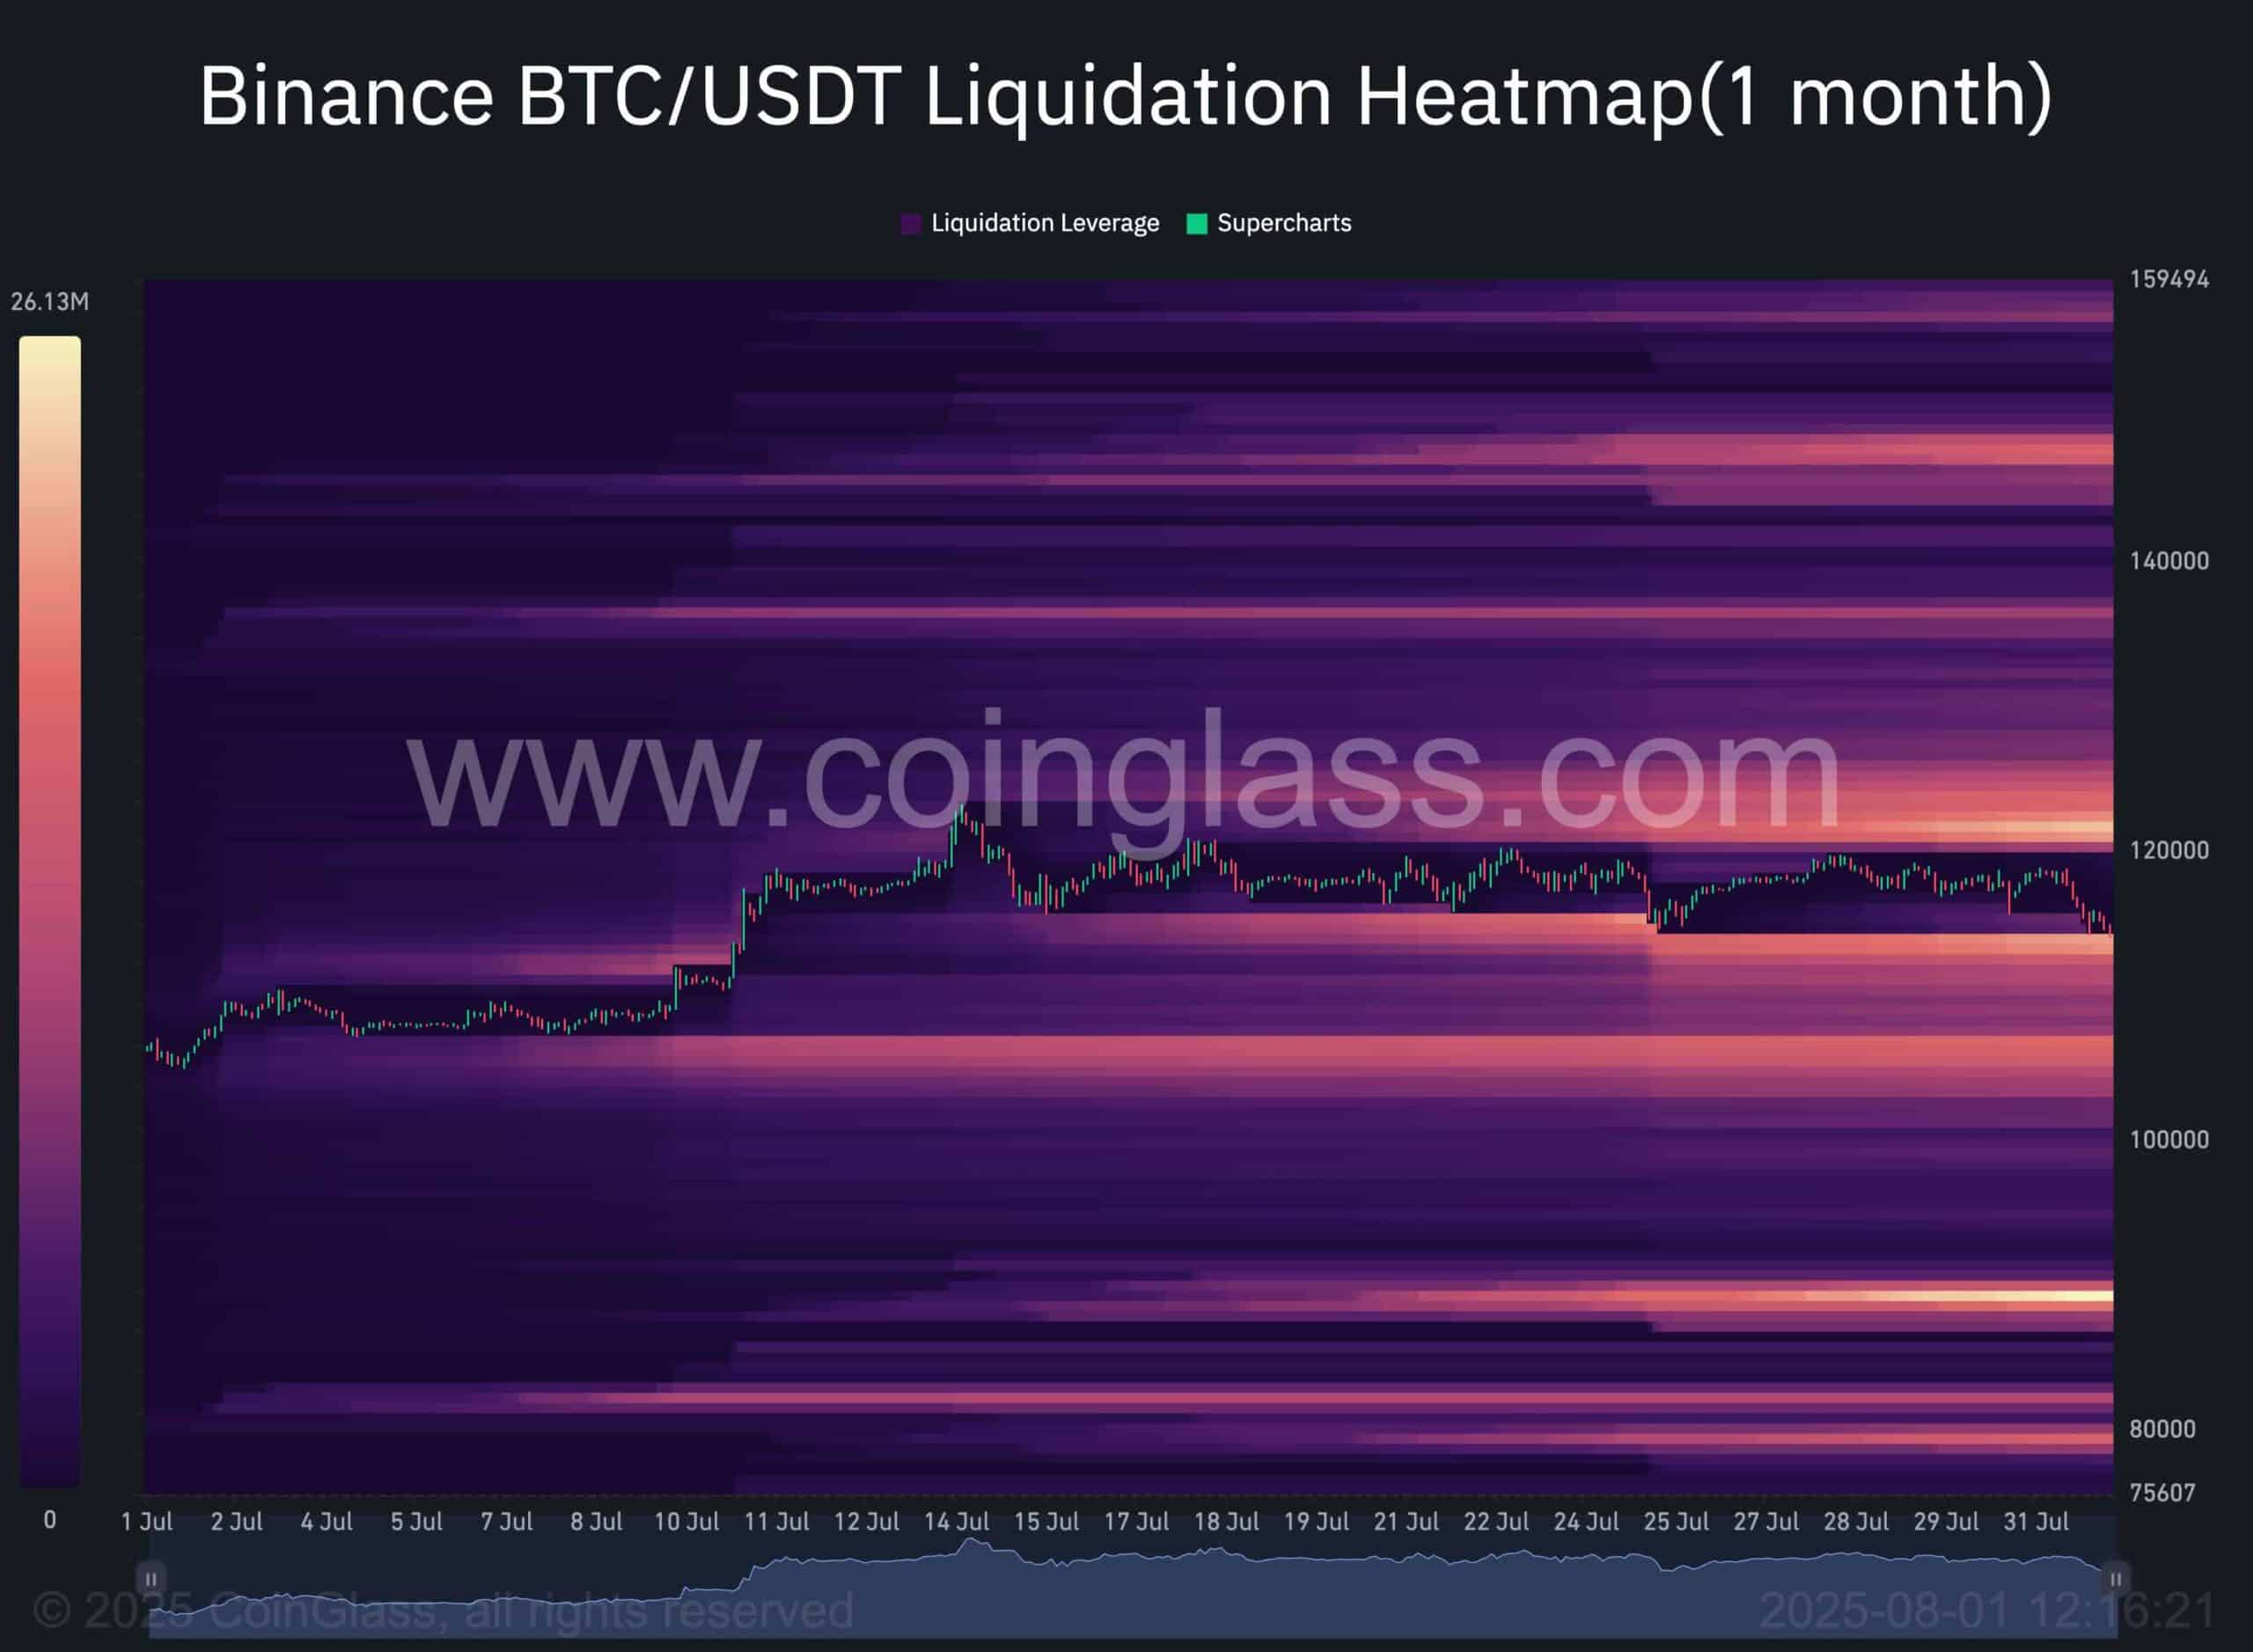
Binance Free $600 (CryptoPotato Exclusive): Use this link to register a new account and receive $600 exclusive welcome offer on Binance (full details).
LIMITED OFFER for CryptoPotato readers at Bybit: Use this link to register and open a $500 FREE position on any coin!
Disclaimer: Information found on CryptoPotato is those of writers quoted. It does not represent the opinions of CryptoPotato on whether to buy, sell, or hold any investments. You are advised to conduct your own research before making any investment decisions. Use provided information at your own risk. See Disclaimer for more information.
Cryptocurrency charts by TradingView.
